

Article summary
In this article, we look at how visuals can affect the way AI systems process and retrieve your documentation. We explain how to use images, diagrams, screenshots, and other visual content without relying on them to carry information that AI may not be able to access effectively.
Visuals can make complex information easier to understand, whether they illustrate relationships between concepts, explain a process, or show users how to complete a procedure. However, visual information is not necessarily available to AI systems in the same way as the surrounding text.
AI models can analyse images, but assistants that answer questions from documentation usually rely on retrieval-augmented generation (RAG). In a typical text-first RAG pipeline, documentation pages are converted to text, split into chunks, and retrieved based on their relevance to a question. Consequently, an image may end up being represented only by its alt text, captions, or other associated text.
This raises the question: how do you use visuals effectively for both human readers and AI assistants? The goal is not to choose between visuals and text, but to understand how one supports the other and what each contributes to documentation. In the sections that follow, we look at how different types of visuals are processed, where information can be lost, and what you can do to make your visual content more useful to AI.
Need help creating AI-ready documentation?
How AI processes visuals
In a text-first retrieval system, a simplified ingestion pipeline might look something like this:

A system may be capable of analysing an image, but that doesn’t mean the information extracted from it will be retained through the rest of the retrieval pipeline. If the visual information isn’t represented in text or another form the retrieval system can use, it may be lost before the answer is generated.
The table below shows key differences between raster and vector graphics in a typical text-first pipeline. The exact processing will vary between systems. Raster images primarily contain pixel data, while formats such as SVG can also contain text and structural information. Whether that information is extracted depends on how the file is processed.
| Raster (JPG, PNG) | Vector (SVG) | |
|---|---|---|
| Pixels analysed | Possible when a vision system processes the image. Not part of a conventional text extraction step. | Not applicable. SVG represents the image as structured vector elements, not pixels. |
| OCR performed | May be used to extract text from the image. | Usually unnecessary, since text is represented as SVG text elements. |
HTML alt, title, figcaption, and surrounding text | Available. | Available. |
| File-embedded metadata | Can include EXIF, IPTC, or XMP metadata, depending on the format. | Can include XML metadata within the SVG. |
| Text contained in visual | Requires OCR or visual analysis to extract from pixels. | Represented directly as text within the SVG. |
Internal <title> and <desc> elements | N/A | Can provide additional textual information about the SVG |
| Structural information | Contains no explicit structural information. | Contains structural information through elements, groups, IDs, and other attributes. |
| Layout relationships | Must be inferred from the image’s visual structure. | Can be inferred from the SVG’s geometry and structure, depending on how the SVG is processed. |
| Diagram semantics | Must be inferred from visual content. | SVG can encode some relationships between elements. |
Can’t we just force-prompt AI to scan images?
We can, but it’s worth considering the cost. Analysing images isn’t the same as processing plain text. Vision-capable models process image inputs differently from text, and the amount of processing required depends on factors such as the image’s dimensions, the level of detail, and the AI model used. Images can consume substantially more input tokens than a short textual description of the same content.
Even a simple diagram can require more processing to interpret than a few sentences explaining the same relationships. How much more depends on the image and the model doing the processing.
Of course, processing one image may cost very little in absolute terms. However, in documentation with thousands of images across a large collection of topics, the costs can quickly add up. Money isn’t the only consideration either: image analysis introduces another step in the pipeline, with its own limitations and potential for errors.
Human-friendly vs AI-ready visuals
It’s best to assume AI won’t make sense of your visuals on their own, beyond basic metadata such as alt text and figure titles. Whatever you convey through images should also be explained in text. Despite this limitation, a sensible compromise is often possible: the right visual in the right context can help your readers, even if it repeats information you’ve already covered.
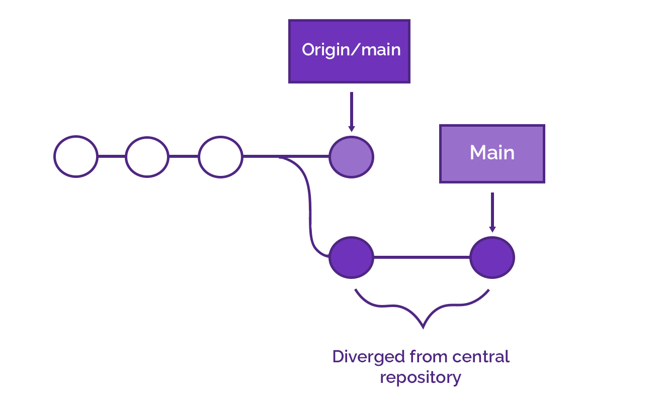
Think of Git, for example. The basics of how it works may seem easy to you if you push commits daily, but try to explain it to a beginner, and before long you’ll be sketching blobs and lines to explain how branching works. Even seasoned Git users draw up graphs when planning new workflows.
Need help making your visuals AI-ready?
Sure, you may argue that since Git is based on graph theory, using a graph is only natural here, but the point remains. Descriptions of complex ideas benefit from visuals that map relationships between concepts, helping users see the bigger picture. If you’ve already explained those relationships in text, the graph simply gives readers another way to visualise them.
Screenshots of a Simplified User Interface (SUI) illustrate the same idea. They make it easier to follow the steps, but if the instructions are well-written, readers can follow them just fine without the screenshots – and so should AI.
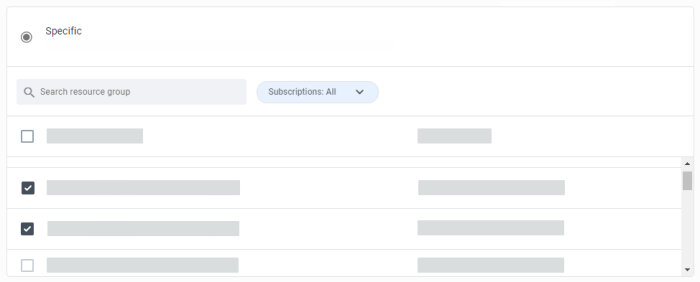
The key takeaway is that visuals should support the text, not replace it. If an image contains information that matters, make sure that information is also available in text.
A few technical considerations
Here are a few things to keep in mind when adding visuals to your documentation.
Descriptive file names and metadata, such as alt text, titles, and captions, give AI systems useful clues about an image and its context. Complex diagrams and charts still need a textual explanation of the information they convey.
AI-ready websites and online docs should use images with stable, direct URLs and appropriate HTML markup and metadata. Images should be present in the page’s DOM when it loads, rather than added later through JavaScript. The Document Object Model (DOM) is the browser’s representation of the page’s HTML structure. Images should also be easy to retrieve and not hidden behind login pages. If you’ve ever tried to enlarge a tiny thumbnail while lurking on an internet forum, only to be prompted to sign up, you know what I’m talking about.
These practices can make images easier for AI systems to retrieve, but they can’t guarantee that an image will be processed. How images are handled depends on the retrieval system, so always make sure to keep the essential information as text.
Key takeaways
When using visuals in documentation, do the following:
- Make sure your textual content can stand on its own.
- Use meaningful file names (e.g.
framemaker-table-example.png). - Include metadata:
- Title attribute
- Alternative text
- Semantic HTML elements such as
<figure>or<figcaption>
- Figure titles (captions)
- Make sure your visuals are regular, accessible URLs:
- Not injected through scripts
- Not embedded as CSS backgrounds
- Not hidden behind authentication
The goal is to make your documentation useful even when an assistant can’t interpret its visuals. AI is constantly evolving, and so is the way it retrieves and interprets information. However, the core principle remains the same: explain concepts in words, then use visuals to complement your explanations.
At 3di, we work with technical documentation and AI, helping teams get more out of their content. Need help making your documentation AI-ready? Let’s get in touch!